The Score-P measurement infrastructure is a highly scalable and easy-to-use tool suite for profiling, event tracing, and online analysis of HPC applications.
Score-P offers the user a maximum of convenience by supporting a number of analysis tools. Currently, it works with Periscope, Scalasca, Vampir, and Tau and is open for other tools. Usually, Score-P is used for post-mortem performance analysis. With the extensions developed in the READEX project, it can now be extended for online analysis. We use its instrumentation for online and post-mortem energy efficiency tuning in the context of READEX.
Score-P is available under the New BSD Open Source license.
Installation
Requirements
The build procedure for the READEX version of Score-P requires the following tools to be already installed:
-
Intel compiler version 2017.2.174/2018.1.163 or GCC (G++ and GFortran) version 6.3.0/7.1.0. Other Intel or GCC compiler versions can also be used, but have not been explicitly tested by the READEX developers.
- PAPI version 5.5.1.
- Bison version 3.0.4.
Note: Other Intel or GCC compiler should also work, but they were not explicitely tested.
Download
Please download the version of Score-P for READEX from the following location and unpack it:
wget -c http://www.readex.eu/wp-content/uploads/2018/08/ScoreP_READEX.tar.gz

tar -xzvf ScoreP_READEX.tar.gz
Preparing the Score-P directory
Please prepare the Score-P build directory as follows:
cd ScoreP_READEX

mkdir build

cd build
Configuring and installing Score-P
You may use the following naming scheme for the “-prefix” argument:
<Desired path for Score-P installation>/scorep/scorep_readex_<version number>_<mpi version>_<compiler version>

<version number>: for example, 11271

<mpi version>: for example, intelmpi2017.2.174

<compiler version>: for example, intel2017.2.174
To run configure please do:
../configure '--prefix=<Desired path for Score-P installation>/scorep/scorep_readex_<version number>_<mpi version>_<compiler version>' \

'--enable-backend-test-runs' \

'--with-nocross-compiler-suite=<gcc|intel>' \

'--with-mpi=<bullxmpi|intel3|...>' \

'--with-libcudart=<path to CUDA installation>' \

'--with-pdt=<path to PDT bin>' \

'--with-papi-header=<path to PAPI include>' \

'--with-papi-lib=<path to PAPI lib>' \

'--with-libbfd=no' \

'--disable-silent-rules' \

'--without-gui' \

'--without-shmem' \

'--enable-static' \

'--enable-shared' \

'--enable-debug' \

'CFLAGS=" -g -O3 -fno-omit-frame-pointer"' \

'CXXFLAGS=" -g -O3 -fno-omit-frame-pointer"' \

make

make install
For more details on installing Score-P, refer to Section 2.1 in [https://silc.zih.tu-dresden.de/scorep-current.pdf].
Usage in READEX
As said, we use Score-P for instrumentation. We distinguish in Phase instrumentation and Region instrumentation for Score-P. Please refer to (TODO) for details. While the Phase instrumentation is manual, region instrumentation can be manual or automatic. We perform the following steps with Score-P.
Initial instrumentation and Filtering
The initial instrumentation is used to filter out regions with a short runtime. This lowers the instrumentation overhead. Depending on your code, you might substitute existing compilers, e.g.,
CC='scorep gcc' , MPICC='scorep mpicc' and so on. There are some things that come with Score-P that might introduce problems. The Score-P user guide and the mailing list can help.
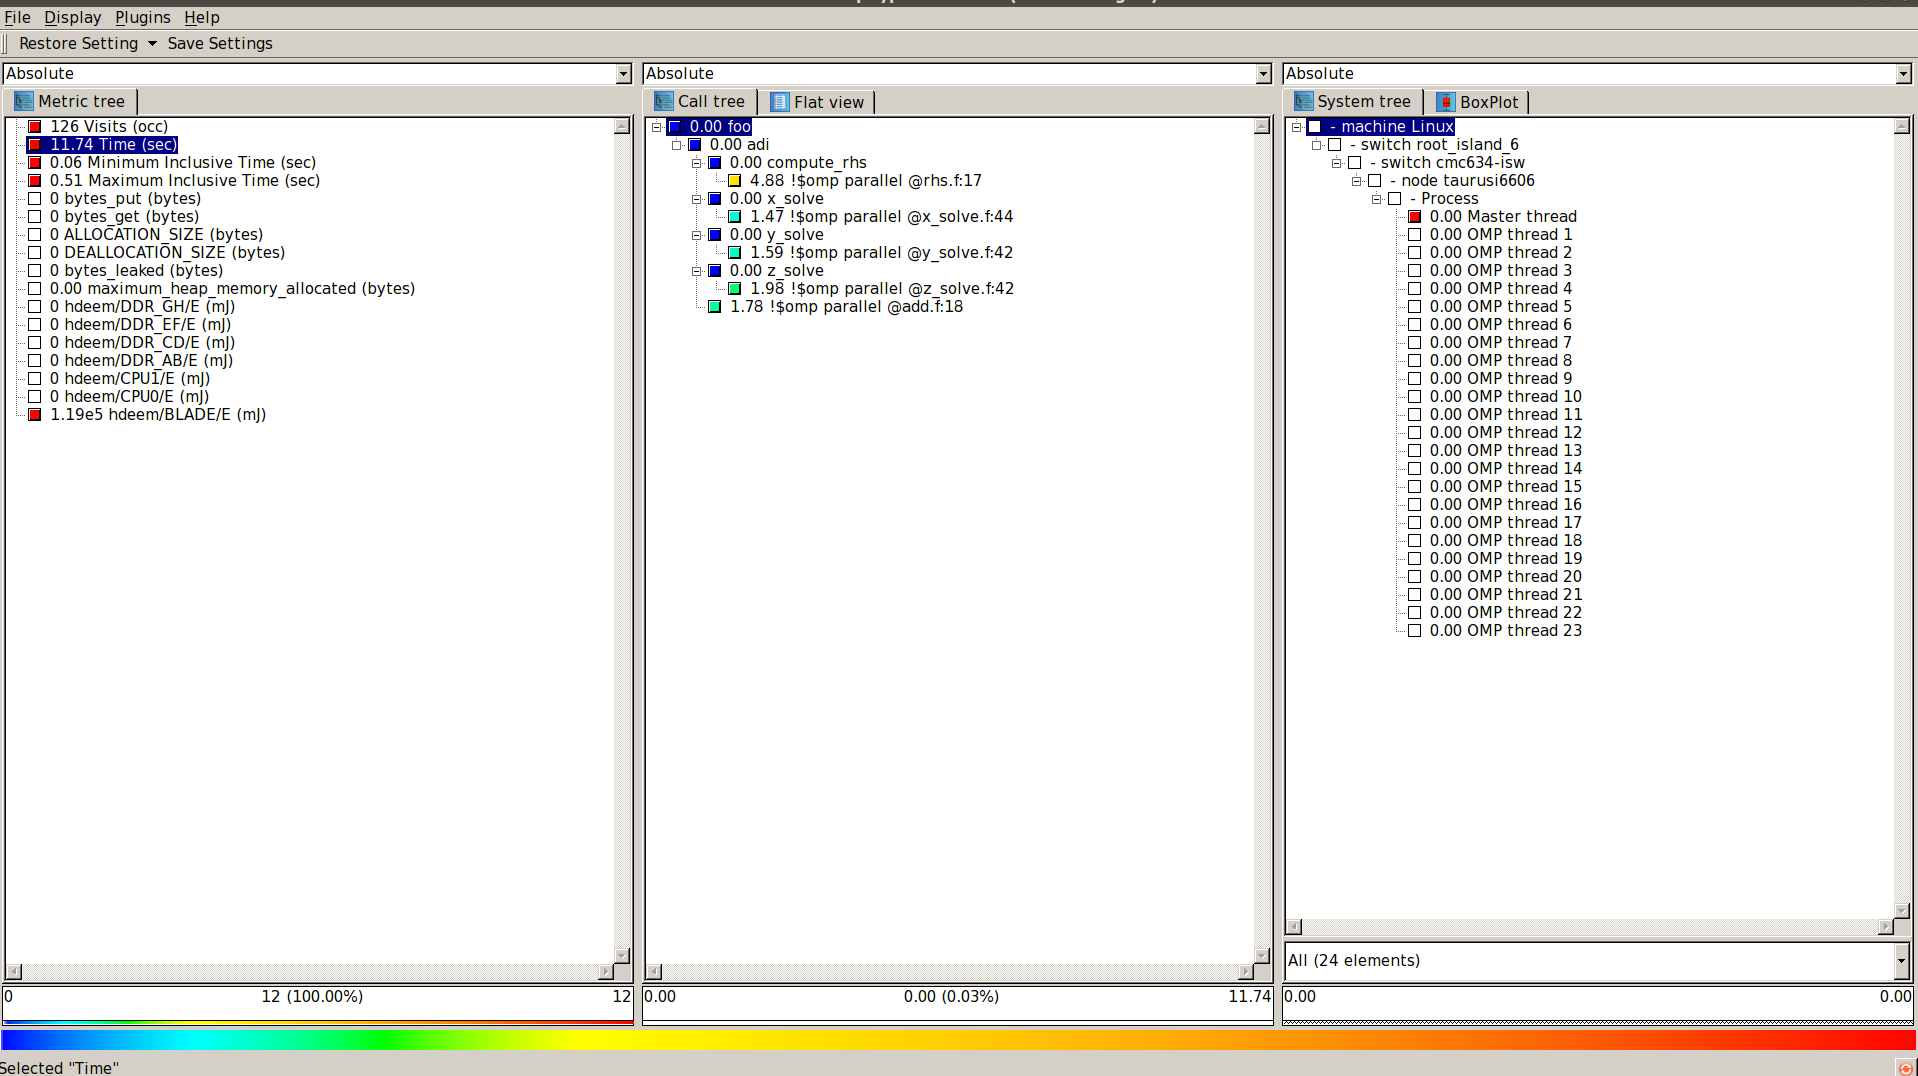
Afterwards, you can run your program as before. Doing so will create a performance profile (that you can analyze with Cube). However, with the Periscope package (TODO link), you also install an auto-filter script, which you can apply to the profile. The script is able to write GNU and Intel filter files. For GNU Compilers, pass the argument --instrument-filter=<filter_file> to Score-P, for Intel, pass it directly to the compiler: FFLAGS="-tcollect-filter <filter_file>. You might be wanting to re-filter afterwards. (Again create a profile, a filer, and re-compile).
Phase instrumentation
Phase instrumentation is manual (since mostly the phase is not an explicit region like a code function. To enable phase instrumentation, find the Phase of your program. I usually do this with a profile or trace analysis. Then add the following lines:
In Fortran:
- Include Score-P header (near the other includes):
#include <scorep/SCOREP_User.inc> - Define phase:
SCOREP_USER_REGION_DEFINE(phase)in the beginning of the function where the phase is located - Tag the start of the phase (usually right after the do-loop header)
SCOREP_USER_OA_PHASE_BEGIN(phase, "Loop-phase", 2) - Tag the end of the phase (usually right before the do-loop is left)
SCOREP_USER_OA_PHASE_END(phase)
In C/C++:
- Include Score-P header (near the other includes):
#include <scorep/SCOREP_User.h> - Define phase:
SCOREP_USER_REGION_DEFINE(phase)in the beginning of the function where the phase is located - Tag the start of the phase (usually right after the do-loop header)
SCOREP_USER_OA_PHASE_BEGIN(phase, "Loop-phase", 2) - Tag the end of the phase (usually right before the do-loop is left)
SCOREP_USER_OA_PHASE_END(phase)
Recompile afterwards and add the --user flag to Score-P. (Do not forget the filter file).
Design Time Analysis
The first step of Design Time analysis is the detection of dynamism. To do so, The tools need some metric information and a special profile format. These can be enabled via the following environment variables:
export SCOREP_PROFILING_FORMAT=cube_tuple

export SCOREP_METRIC_PAPI=PAPI_TOT_INS,PAPI_L3_TCM
Run the application, which will create another profile, which can be analyzed with readex-dyn-detect, which is part of the READEX Periscope package.
In the next step, re-compile the application and enable online-access. Usually this is done by using the Score-P flag --online-access , for example, scorep --online-access --user --nomemory mpif90 instead of mpif90. Do not forget to add the filter file here.
The following things need to be set-up for Score-P to work with DTA.
export SCOREP_SUBSTRATE_PLUGINS=rrl # Periscope uses the RRL

export SCOREP_RRL_PLUGINS=cpu_freq_plugin,uncore_freq_plugin # here we define the PCPs

export SCOREP_RRL_VERBOSE="WARN"

# set-up energy measuremenent (see Score-P metric plugins)

...
Compiling for Runtime Usage
After you analyzed the program using Periscope and got a tuning model, you can re-compile it to lower some overhead due to supporting Periscope. just skip the --online-access flag from the compilation before.
Sources
[Website]: http://www.vi-hps.org/projects/score-p/
[GitHub]: https://github.com/score-p
[Download tarball]
[1] K. Diethelm, “Tools for assessing and optimizing the energy requirements of high performance scientific computing software” PAMM, Volume 16 Issue 1
doi:
